Research
Aesthetics of Mathematics Education Research
The lines along which some endeavor is (dis)classified as mathematics education research are neither given nor neutral. The foci and acceptable topics of inclusion in mathematics education research have shifted across time: what is mathematics education research is the product of the collective efforts of many mathematics education researchers publishing research in the name of mathematics education research. My own work uses a complimentary variety of quantitative (graph theory, community-finding algorithms), qualitative (discourse analysis, coding), and humanities-oriented (art, history, philosophy) methods.

Research and the Field of Mathematics Education Research
My understanding of research is that it is not comprised of standalone capsules of knowledge but rather an interconnected network of ideas and writings that are connected through complex citation patterns. My research takes the form of citation networks of the field of mathematics education research. This aesthetically pleasing (to me) representation, that I have included below, is the JRME equity issue from 2013. A node for every article from the equity issue is placed along the horizontal axis, then each of the articles, books, chapters, etc. that those articles cite are added as nodes to the horizontal axis. When one article cites another, an arc is drawn that connects the citing article to the cited article.
These networks, however, are more than artwork. They remain data and each node retains author, year, title, and citation information. Interactive networks for public use are coming soon. I imagine these maps will be useful not only to established researchers to quickly find relevant articles but also to graduate students to help in establishing a 'lay of the land' of mathematics education research.
What do you wonder?
(mouseover)
3 cups
Blueberries
Arc Color
Identifies citing article
Arcs
Citation relationships
Node Size
Proportional to Citation Count
Nodes
Article, Book, Chapter, etc.
Node Size
Proportional to Citation Count
Complementary Methods: Mathematics & Computer Science, Cartography, History, Data Art, Philosophy
At minimum, there are five complementary methods at play in my work:
-
Mathematics & Computer Science - The methods of data extraction, preparation, and analysis draw heavily on my background as a computer scientist. Some tools are custom developed, e.g., my JSTOR Reference Extractor that automates citation extraction from JSTOR to a delimited Excel file, while others are freely available Gephi, Cytoscape, VOSViewer. Quantitative aspects of analysis come from graph theory and some theorems are invoked to show existence and uniqueness when possible.
-
Cartography - Cartography, in the traditional sense, made a map between three-dimensional land and a two-dimensional planar representation. Cartography, as I use it, maps mathematics education research, a non-planar network of connected articles, books, chapters, etc., onto various two- and three-dimensional representations to make particular rhetorical arguments. Some samples are included below.
-
History - History is one way of answering the question 'what has been?' It draws on particular sources (archives, testimony, etc.) and methods to establish a particular version of what has been. Nonetheless, it is important to consider whose perspectives are excluded from the 'official story' contained in archives, whose testimonies are sought, etc. I draw on historical methods to provide stories about what has been done in the name of mathematics education.
-
Philosophy - If history is one way of answering 'what has been?', I see philosophy as asking the question 'what could be?'. I draw on philosophical methods to imagine what could be possible in the name of mathematics education research.
-
Data Art - Data Art is a fuzzy space between art and data that pushes against neat division between the two categories. The images I create are art in the sense that they provide a way to see some aspect of the world. They are data because they retain the data information and serve as a resource for myself and others.

Density graph of the 500 most recently published articles in mathematics education research. Layout after clustering algorithm has been run 100 times, layout attraction 2 and repulsion 1.

Image with multiply-cited articles in the middle and singly-cited articles at the margin. Visual representation of the central-marginal metaphor.

What do you wonder? Representation of the JRME Equity Issue.

The identified communities in the field of mathematics education research in the 1970s in one subset of data.

The identified communities in the field of mathematics education research in the 1980s in one subset of data.

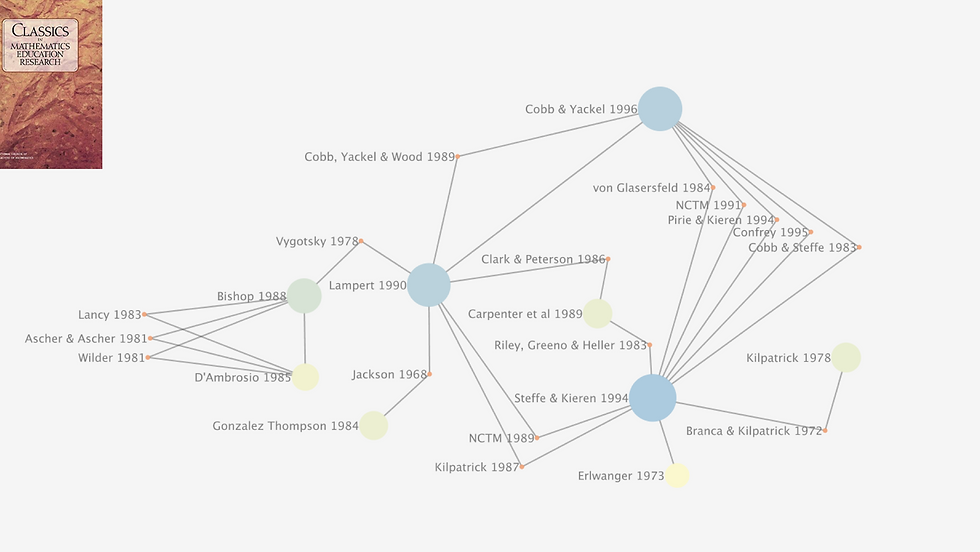
Overview of the largest connected component of the 'Classics in Mathematics Education Research' (NCTM). Shows the narrow scope of perspectives included in the book.

Detailed view of the largest connected component of the 'Classics in Mathematics Education Research' (NCTM). Shows the common perspectives included in the book.
